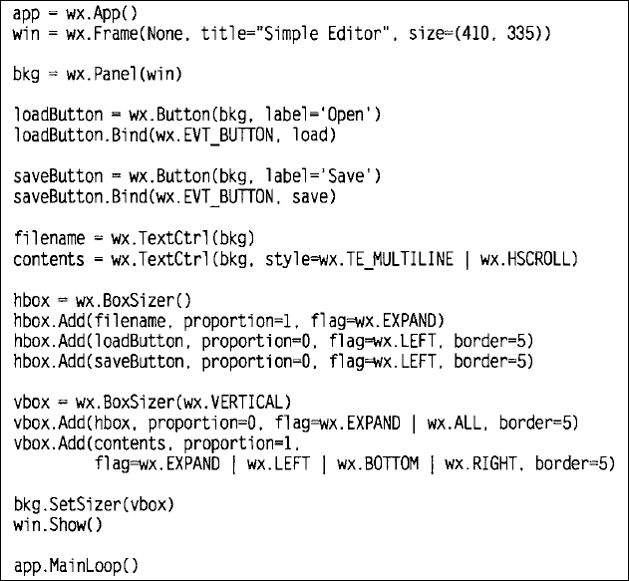
|
经济,金融数据应用
利用matplotlib抓取yahoo finance里的历史数据并绘图
Python当中的matplotlib module有一个finance module能够获取各公司的股票历史数据并绘图。


from
pylab import figure, show
from matplotlib.finance import quotes_historical_yahoo
from matplotlib.dates import YearLocator,
MonthLocator, DateFormatter
import datetime
date1 = datetime.date( 2013, 1, 1 )
date2 = datetime.date( 2013, 11, 11 )
daysFmt = DateFormatter('%m-%d-%Y')
quotes = quotes_historical_yahoo('MSFT', date1,
date2) # 获取在date1和date2期间的微软股票
if len(quotes) == 0:
raise SystemExit
dates = [q[0] for q in quotes]
opens = [q[1] for q in quotes]
fig = figure()
ax = fig.add_subplot(111)
ax.plot_date(dates, opens, '-')
# format the ticks
ax.xaxis.set_major_formatter(daysFmt)
ax.autoscale_view()
# format the coords message box
def price(x): return '$%1.2f'%x
ax.fmt_xdata = DateFormatter('%Y-%m-%d')
ax.fmt_ydata = price
ax.grid(True)
fig.autofmt_xdate()
show() |
quotes_historical_yahoo是一个获取yahoo历史数据的函数,需要输入公司的Ticker Symbol和查询起止日期,输出为一缓冲文件,具体代码如下:
def
quotes_historical_yahoo(ticker, date1, date2,
asobject=False,
adjusted=True, cachename=None):
"""
Get historical data for ticker between date1
and date2. date1 and
date2 are datetime instances or (year, month,
day) sequences.
See :func:`parse_yahoo_historical` for explanation
of output formats
and the *asobject* and *adjusted* kwargs.
Ex:
sp = f.quotes_historical_yahoo('^GSPC', d1,
d2,
asobject=True, adjusted=True)
returns = (sp.open[1:] - sp.open[:-1])/sp.open[1:]
[n,bins,patches] = hist(returns, 100)
mu = mean(returns)
sigma = std(returns)
x = normpdf(bins, mu, sigma)
plot(bins, x, color='red', lw=2)
cachename is the name of the local file cache.
If None, will
default to the md5 hash or the url (which
incorporates the ticker
and date range)
"""
# Maybe enable a warning later as part of
a slow transition
# to using None instead of False.
#if asobject is False:
# warnings.warn("Recommend changing to
asobject=None")
fh = fetch_historical_yahoo(ticker, date1,
date2, cachename)
try:
ret = parse_yahoo_historical(fh, asobject=asobject,
adjusted=adjusted)
if len(ret) == 0:
return None
except IOError as exc:
warnings.warn('fh failure\n%s'%(exc.strerror[1]))
return None
return ret |
parse_yahoo_historical函数可对历史数据进行解析,读取文件,对文件部分内容进行操作,代码如下:
def
parse_yahoo_historical(fh, adjusted=True,
asobject=False):
"""
Parse the historical data in file handle fh
from yahoo finance.
*adjusted*
If True (default) replace open, close, high,
and low prices with
their adjusted values. The adjustment is by
a scale factor, S =
adjusted_close/close. Adjusted prices are
actual prices
multiplied by S.
Volume is not adjusted as it is already backward
split adjusted
by Yahoo. If you want to compute dollars traded,
multiply volume
by the adjusted close, regardless of whether
you choose adjusted
= True|False.
*asobject*
If False (default for compatibility with earlier
versions)
return a list of tuples containing
d, open, close, high, low, volume
If None (preferred alternative to False),
return
a 2-D ndarray corresponding to the list of
tuples.
Otherwise return a numpy recarray with
date, year, month, day, d, open, close, high,
low,
volume, adjusted_close
where d is a floating poing representation
of date,
as returned by date2num, and date is a python
standard
library datetime.date instance.
The name of this kwarg is a historical artifact.
Formerly,
True returned a cbook Bunch
holding 1-D ndarrays. The behavior of a numpy
recarray is
very similar to the Bunch.
"""
lines = fh.readlines()
results = []
datefmt = '%Y-%m-%d'
for line in lines[1:]:
vals = line.split(',')
if len(vals)!=7:
continue # add warning?
datestr = vals[0]
#dt = datetime.date(*time.strptime(datestr,
datefmt)[:3])
# Using strptime doubles the runtime. With
the present
# format, we don't need it.
dt = datetime.date(*[int(val) for val in datestr.split('-')])
dnum = date2num(dt)
open, high, low, close = [float(val) for val
in vals[1:5]]
volume = float(vals[5])
aclose = float(vals[6])
results.append((dt, dt.year, dt.month, dt.day,
dnum, open, close, high, low, volume, aclose))
results.reverse()
d = np.array(results, dtype=stock_dt)
if adjusted:
scale = d['aclose'] / d['close']
scale[np.isinf(scale)] = np.nan
d['open'] *= scale
d['close'] *= scale
d['high'] *= scale
d['low'] *= scale
if not asobject:
# 2-D sequence; formerly list of tuples, now
ndarray
ret = np.zeros((len(d), 6), dtype=np.float)
ret[:,0] = d['d']
ret[:,1] = d['open']
ret[:,2] = d['close']
ret[:,3] = d['high']
ret[:,4] = d['low']
ret[:,5] = d['volume']
if asobject is None:
return ret
return [tuple(row) for row in ret]
return d.view(np.recarray) # Close enough
to former Bunch return |
另外,如果无需操作历史数据,只需下载存储到本地文件可参考下面代码:
#this
example can download the data in finance.yahoo
and put in our computers
import os,urllib2,urllib
ticker = 'MSFT' #the Ticker Symbol
date1 = ( 2012, 1, 1 ) #begining time
date2 = ( 2012, 11, 11 ) #ending time
d1 = (date1[1]-1, date1[2], date1[0])
d2 = (date2[1]-1, date2[2], date2[0])
g='d'
urlFmt = 'http://table.finance.yahoo.com/table.csv?a=%d&b=%d&c=%d&d=%d&e=%d&f=%d&
s=%s&y=0&g=%s&ignore=.csv'
url = urlFmt % (d1[0], d1[1], d1[2],
d2[0], d2[1], d2[2], ticker, g) #the url of
historical data
print url
path = r'C:\Users\yinyao\Desktop\Python code'
#Saving path
file_name = r'\ticker.csv' #file name
dest_dir = os.path.join(path,file_name) #located
file
urllib.urlretrieve(url,dest_dir) #download
the data and put in located file |
|