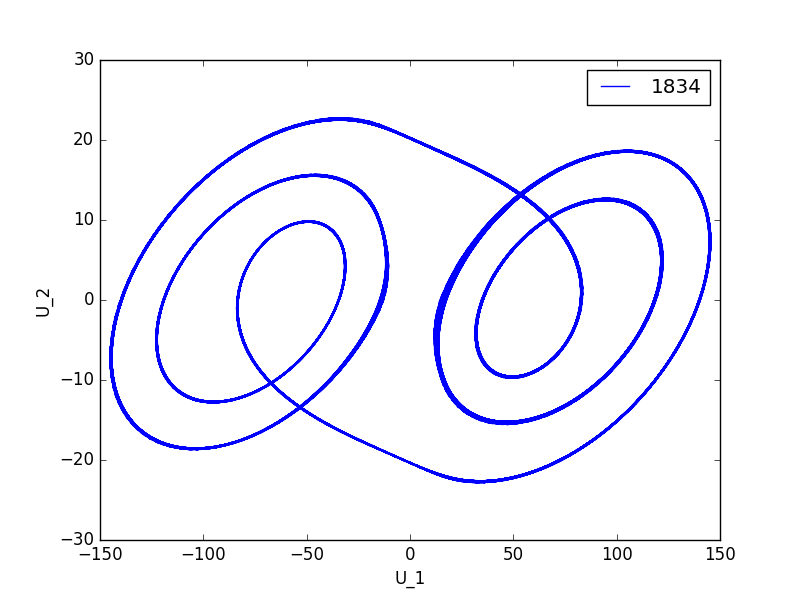
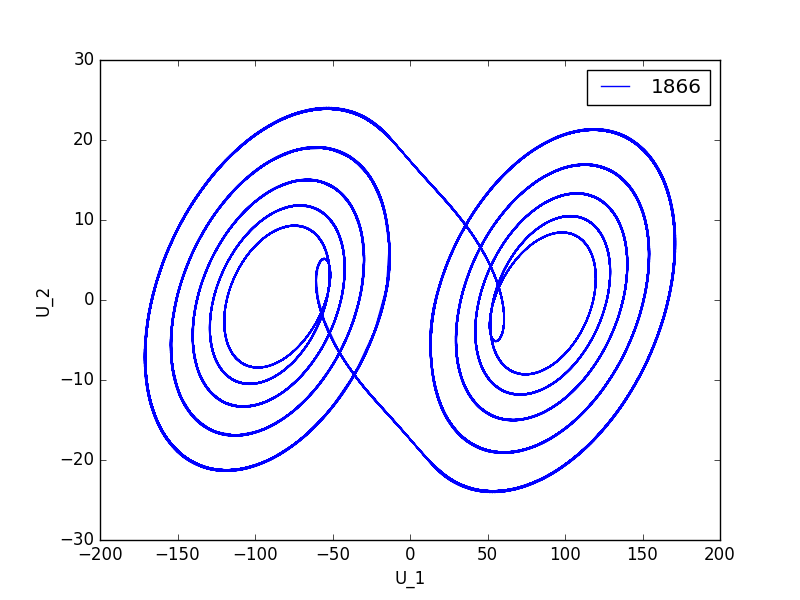
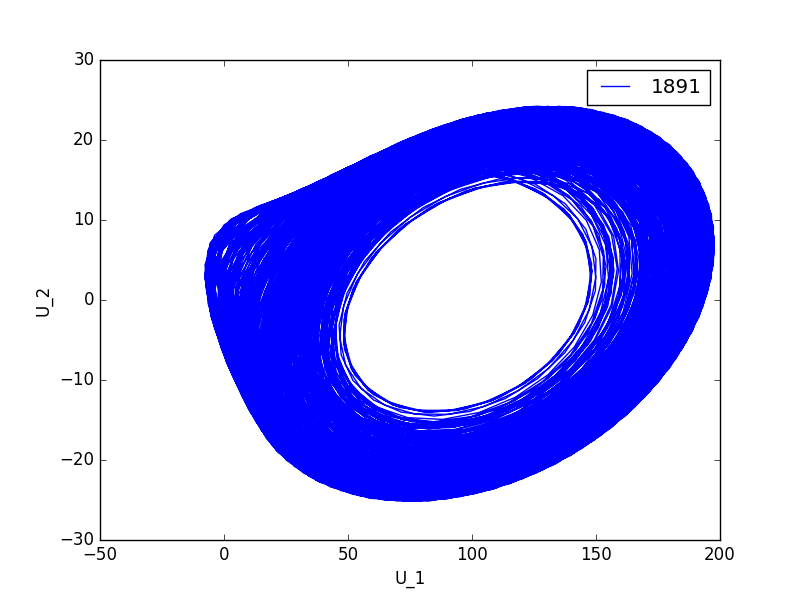
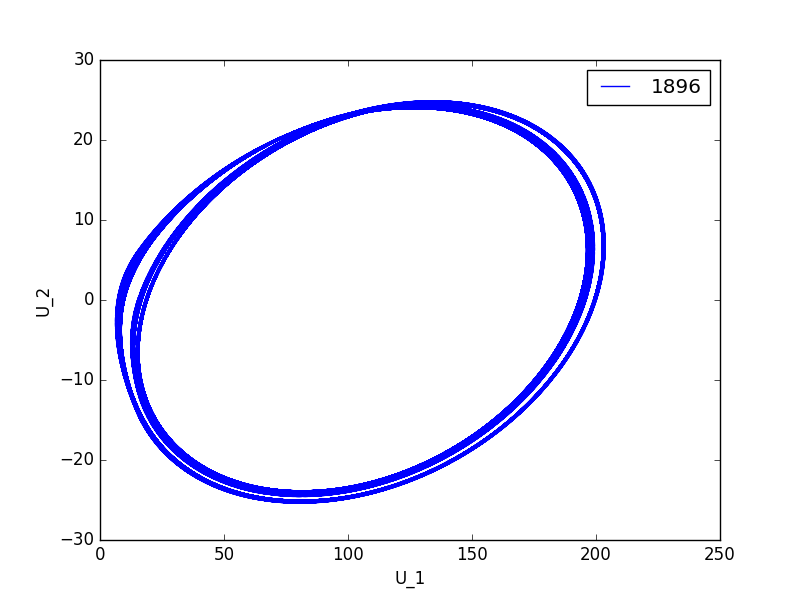
| 分形与混沌之-蔡氏电路模拟
具体理论部分参见: 蔡氏电路仿真实验
R= 1500 -1960 的模拟图集成包 plots.zip
下载


代码如下: 注意, python 2.7 下不能够正常运行.
#
-*- coding: utf-8 -*-
#author = whyx v 0.1 updated from 马雨枫's version
#passed on python 3.5.2 on pycharm 2016.3
import numpy as np
from scipy.integrate import odeint
import matplotlib.pyplot as plt
def Nlfunction(V_1):
Ga=-0.00076
Gb=-0.00049
E=15.0
retg=Gb*V_1+(Gb-Ga)/2*(abs(V_1-E)-abs(V_1+E))
return retg
def delta(y,t):
global R
C1=9.91e-9
C2=98.2e-9
l=23.0e-3
G=1/R
ret_delta =np.array([(G*(y[1]-y[0])-Nlfunction(y[0]))/C1,
(G*(y[0]-y[1])+y[2])/C2,
-y[1]/l])
return ret_delta
time=np.linspace(0,0.2,10000)
#r=range(1800,1960,1)
#r=range(1960,1999,1)
r=[1500, 1700, 1806, 1810,1811, 1834, 1842,
1843,1844,1845,1846,1851,1866,1881,1887,1890,1891,1896,
1897,1898, 1901, 1904,1940,]
#r=[1500, 1600, 1700, 1800, 1815, 1827,
1960]
#yinit=np.array([0.0,0.001,0.001])
yinit=np.array([0.0,0.0,0.001])
#print yinit
global R
plt.figure()
for R in r:
y = odeint(delta,yinit,time)
plt.plot(y[1000:,0],y[1000:,1] , label =
R )
# plt.plot(time[1000:2000],y[1000:2000,1])
# plt.plot(y[1000:, 1], y[1000:, 2], label
= R )
plt.xlabel('U_1')
plt.ylabel('U_2')
plt.legend()
plt.savefig('%domega'%R)
plt.clf()
#plt.show() |
|
